One of our clients questioned us if we have any way to know the average software budget by institutions every year. Without any preliminary research, our initial answer was no. Then, a few months passed, during which we drilled down contracts and other implementation data. Now, we can say that we have a vague idea.
As many know, we go through public sources to find implementation data to build on our database. One of the sources we use is contracts and invoices. During these months of research, we extracted portions of that information. What we have found can offer a partial answer to the question asked by our client.
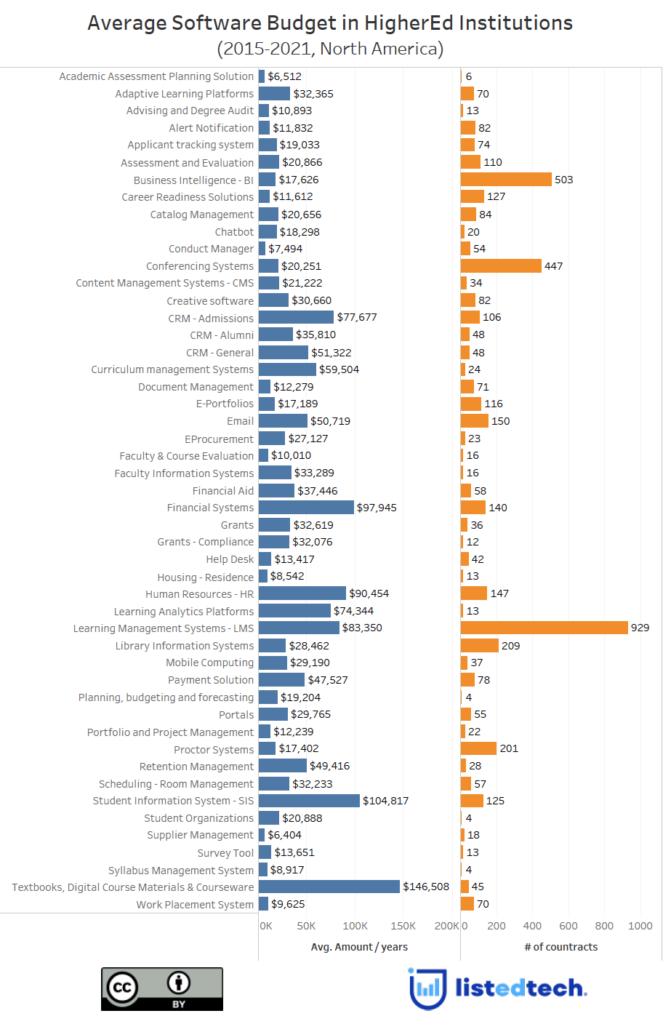
To build our graph, we only included contract information from 4,684 HigherEd institutions between 2015 and 2021.
We need to inform our readers that we have stumbled upon some issues during this project. Even if they are all apples, it’s not always easy to compare software between institutions. Some may be green or red, others are tart or sweet. While looking at the graph, keep in consideration the following notes:
- In some product categories, definitions are not entirely defined.
- We have made assumptions as some of the contracts/invoices have very little information.
- We didn’t have enough data to compare institutions regarding their enrolment size, institution type or if the institution have bought the software as part of a state-wide contract.
Is this a perfect analysis? No way. It’s more of a back-of-a-napkin calculation except that we used aggregated data. On the left side of the graph (the blue bars) you will find the average software budget by product category, while the right column (the orange bars) reprensents the number of contracts used to make the average.
A few comments and notes on the actual data:
- We were quite surprised to find out that the textbook category has an average of more than $145,000 per year. Since we have found data for over 45 contracts, it’s fair to say that it’s not outlier information. Does anyone have an idea why this product category costs more than SIS, LMS, ERP, etc.?
- As expected, the LMS category (929) has the most numerous contracts, followed by business intelligence (503) and conferencing systems (447). Therefore, we think that these categories represent more accurately the reality of the whole market.
A typical HigherEd institution spends an average of $1,670,687 annually to maintain its different systems. This is based on 49 product categories. We have more than 100 categories in our database but did not have enough data to use in this calculation. Since not all universities use all systems, this is a starting point.
Supplemental information since the initial publication:
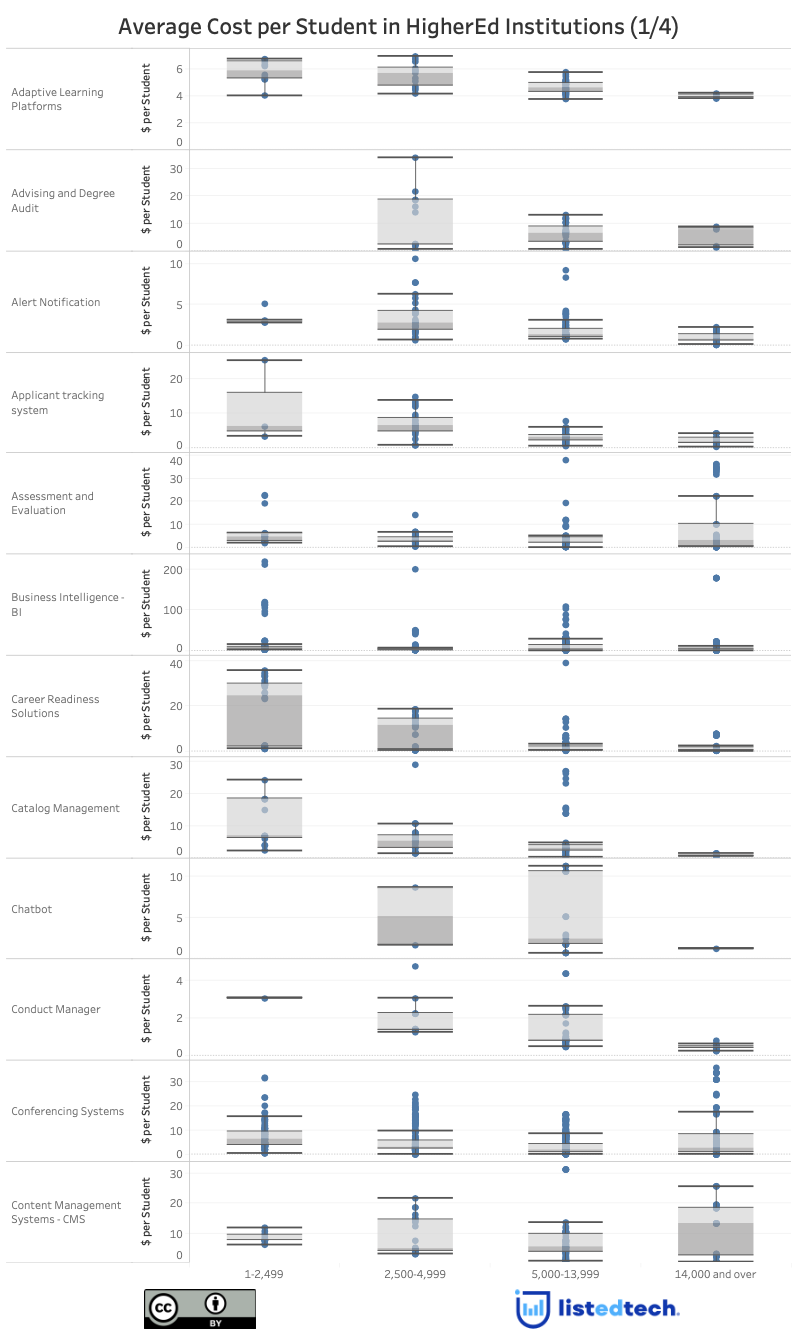
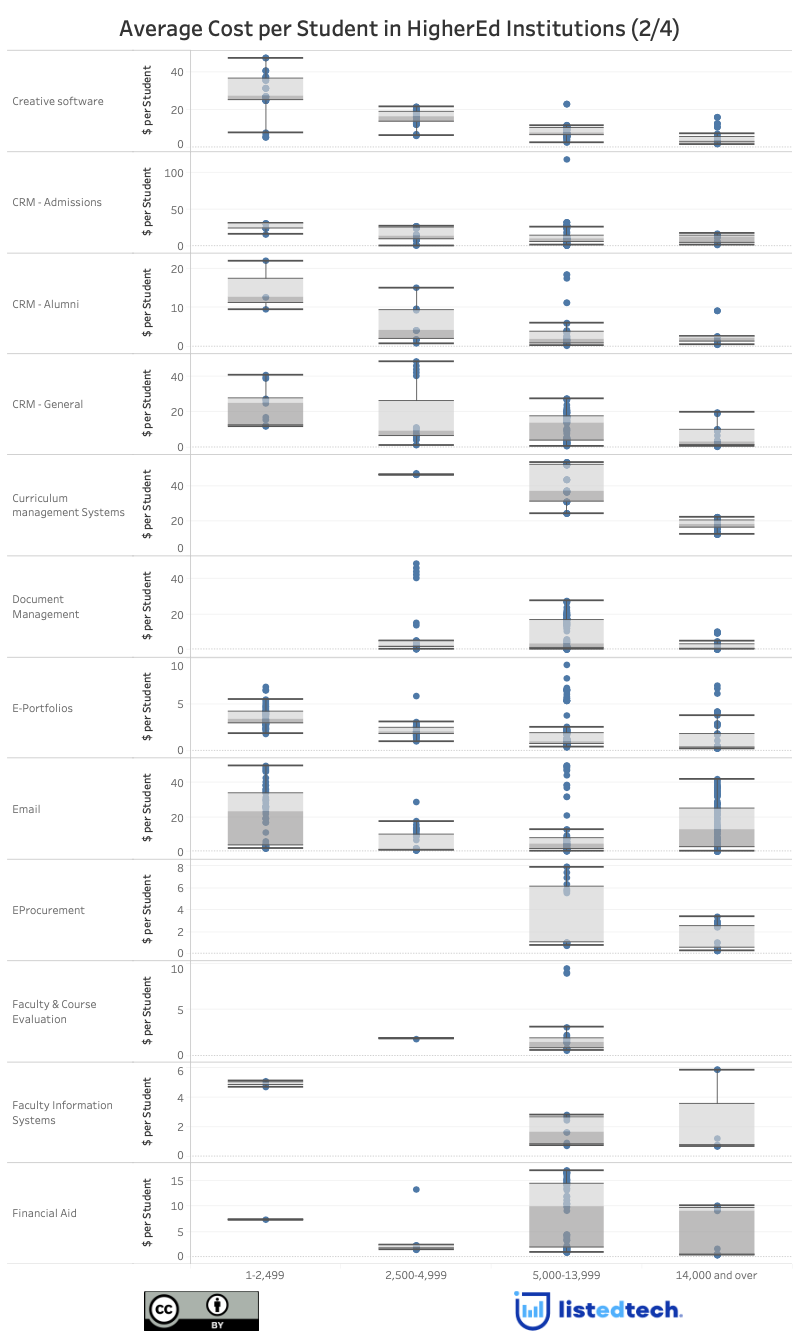
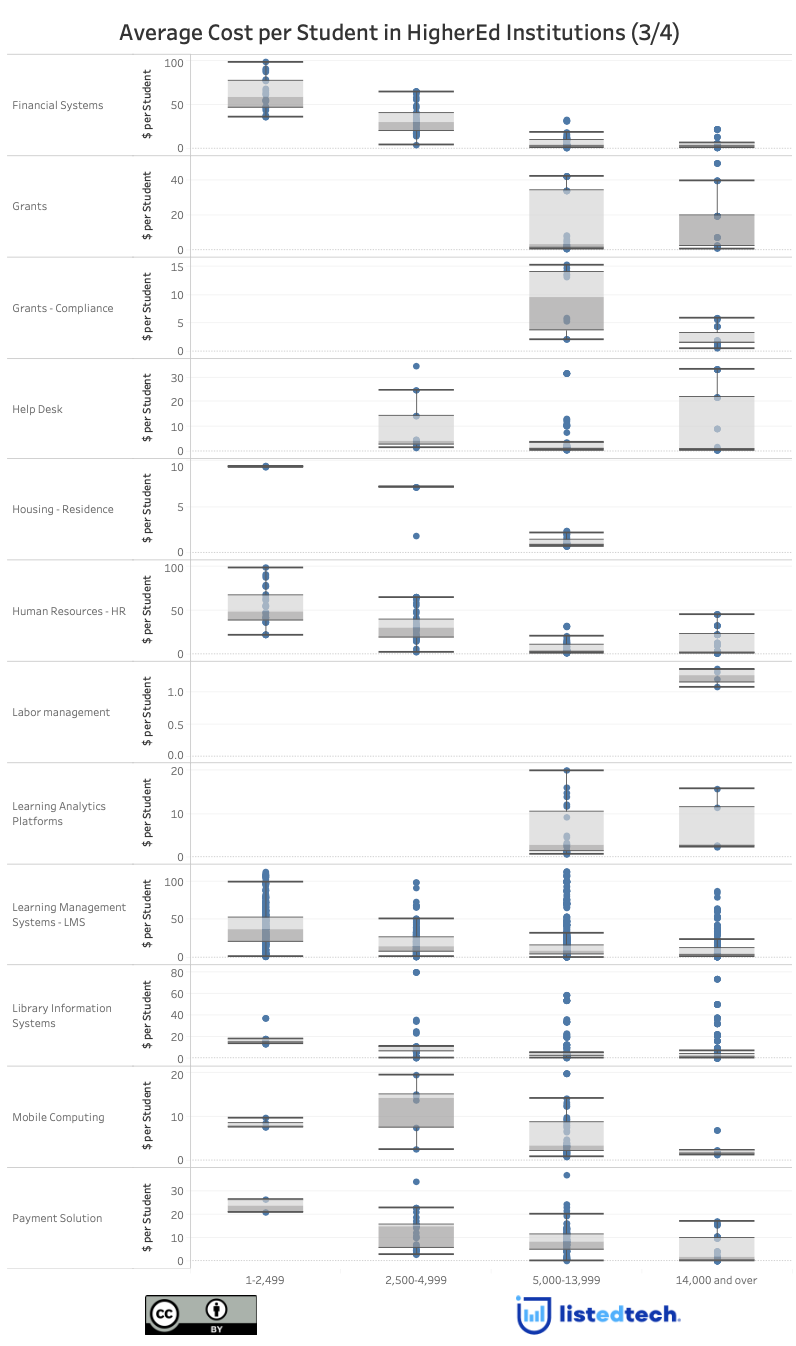
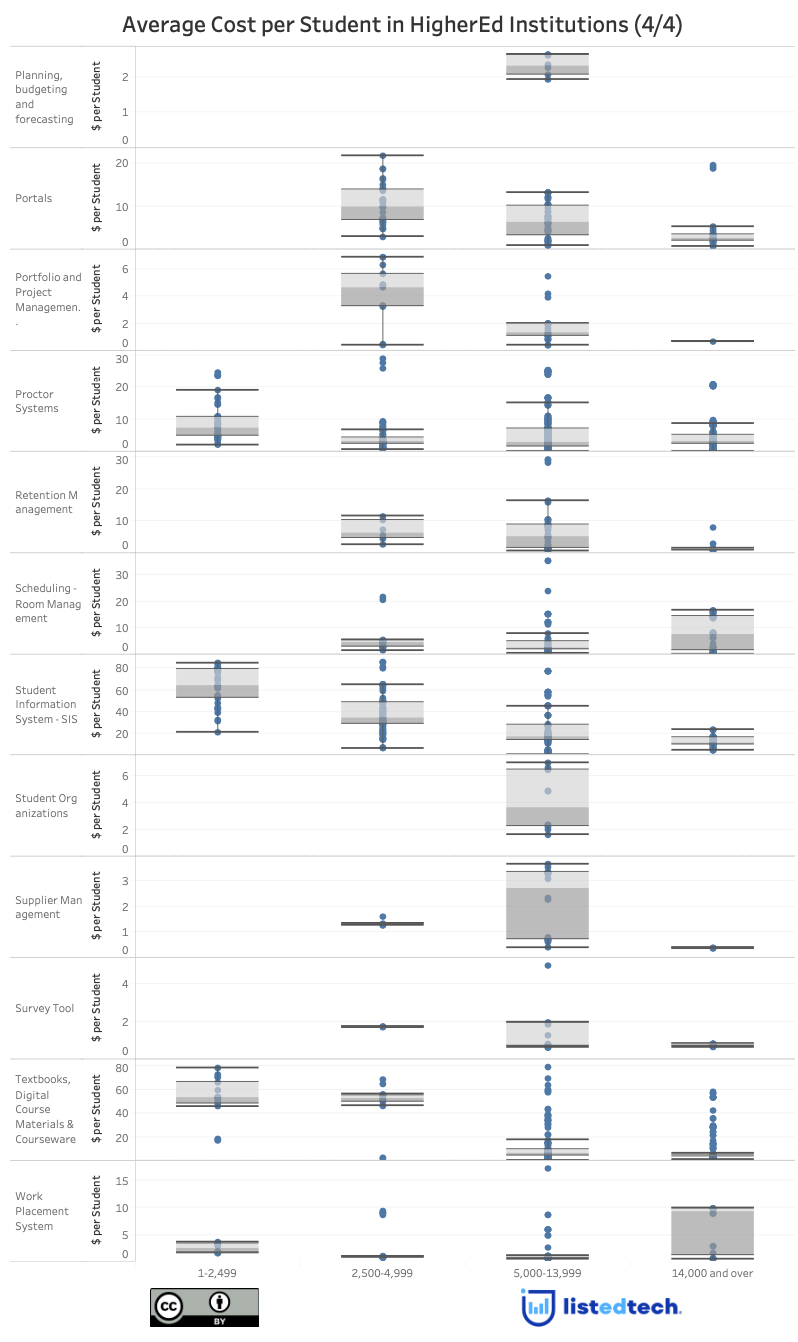
Average Cost per Student
Following the initial publication of this post, our newsletter subscribers said that this average software budget represents a somewhat biased view of the software budget. They asked: is it possible to produce the same graph with cost per student instead of the overall budget? It sure is! We even improved our data presentation by segmenting the data per enrollment band.