Key Takeaways:
- Technology, such as advising and planning tools, can positively influence student success outcomes, but institutional characteristics often play a larger role.
- Spending on instructional support and student-faculty ratios have a significant impact on student graduation rates.
- Analyzing technology’s impact through causal inference helps institutions better understand how to support student success.
There has been an increasing focus on measuring the value of higher education by improving outcomes. For example, in 2021, the Education Trust analyzed state-based outcomes-based funding policies to understand whether they equitably address and advance student enrollment, retention, and completion. Likewise, organizations such as the Institute for Higher Education Policy and the Third Way highlight other metrics, such as post-enrollment earnings, to measure how well colleges and universities are helping their students achieve success.
This focus is essential, especially as students pay more to attend college and must ensure they get the most out of their education. Yet, despite this focus, little attention has been paid to the role higher education technology might play in improving student outcomes, which is surprising given the billions of dollars spent on technology solutions. This week’s post offers a method to understand this role.
Our Approach
A standard way to understand the relationship between technology and student outcomes in higher education would be to explore whether there was a robust correlative relationship between the two. Another approach, which appears in a previous post, uncovers any patterns between high-performing institutions and their technology solutions and explore whether these patterns contributed to student outcomes.
Here, we take a different approach. To explore the role of technology in improving student outcomes, we leverage causal inference. This technique moves beyond correlation and regressions to determine the causal impact between treatments (technology in this case) and outcomes. To perform this analysis, we collected six-year completion IPEDS data for just under two thousand US four-year higher education institutions – public and private. Likewise, to ensure that we isolated the impact of technology on outcomes, we added other IPEDS datasets that might influence this impact (percent of expenditures devoted to instructional or academic support) as well as context variables such as student enrollment size overall and by subgroups (race, etc.). Then, we limited the technology categories to those more likely to impact student success outcomes (degree auditing solutions, for example) and grouped them into four groups, i.e. advising tools, institutional planning tools (assessment and evaluation, etc.), student support tools (tutoring, etc.), and student planning tools (degree auditing, etc.).
Our Findings
The first step in undertaking causal inference is determining the relationships between the different factors, as the line arrows indicate. Figure 1 shows our dataset’s most robust causal relationships, controlling for the context factors (student enrollment size, for example). For instance, student planning tools have a causal relationship with the six-year graduation rate; institutions with one of the solutions in this category have a fourteen percent higher average six-year graduation rate than those without. Likewise, institutions with advising tools have a two-percent higher average student-to-faculty ratio than those who do not.
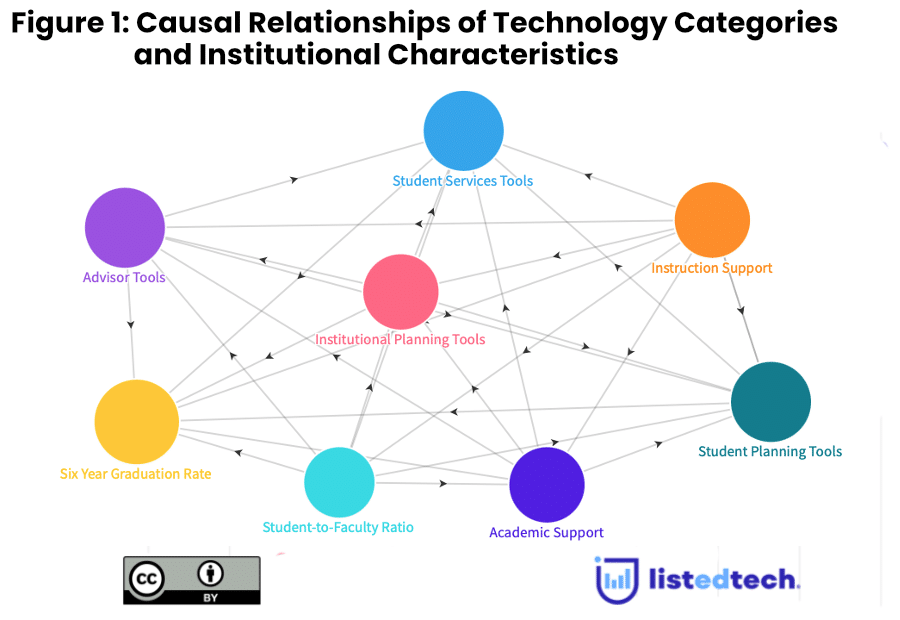
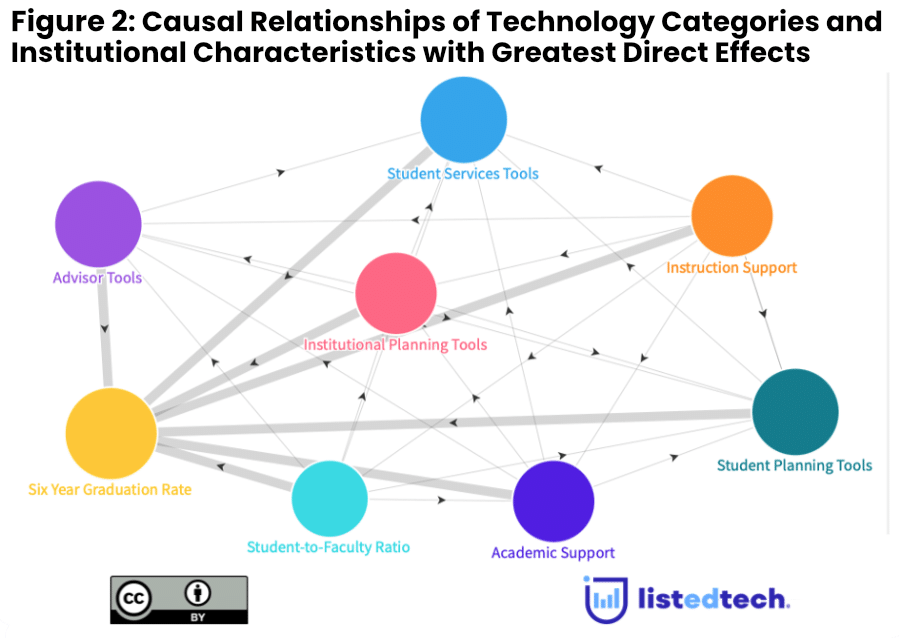
However, while exploring the different causal relationships to determine how factors impact each other might be helpful, it must address which technology significantly impacts student success outcomes. Figure 2 addresses this question, with the strength of the causal relationship indicated by the thickness of the lines. Our analysis shows that the most significant causal relationships are not between the average six-year graduation rate and technology but between other institutional characteristics. For example, institutions with between 86% and 96% of expenditures devoted to instructional support have an average six-year graduation rate of 61%, seven percentage points above the average graduation rate for all institutions in our dataset (54%). Also, institutions with student-faculty ratios between seventy-two and eighty-two have an average six-year graduation rate of 78%, well above the average graduation rate for all institutions in our dataset.
As for technology, advising and institutional planning tools have the highest causal relationship with the average six-year graduation rate. Institutions with advising tools have a higher average six-year graduation rate (54%) than those with none (49%). Likewise, institutions with institutional planning tools (assessment and evaluation tools, for example) have a higher average six-year graduation rate (55%) than those with none (51%).
Based on this analysis, while some technology has a strong causal relationship with our measured student outcome, other institutional characteristics have the most substantial relationships. Also, some technology is unsurprisingly related to higher average six-year graduation rates (advising tools). In contrast, others, like institutional planning, have a more significant causal impact than we might expect (student planning tools, for example).
Summary
Many factors influence student success, including institutional spending on academic support and advising efforts. Likewise, these factors may vary in impact depending on an institution’s student population (first-time, transfer, etc.) and student preparedness to undertake college-level study.
Yet, by controlling for these influences, we can isolate the potential impact of technology on improving student success. Leveraging an analysis like this one could help institutional leaders understand how best to populate their ecosystems to support their students along their journeys. Likewise, adding this analysis to the other approaches to identify student success metrics would enrich our understanding of the inputs and outputs of student success and help us make more informed choices about how best to ensure that students leave college with the best chance to succeed.